

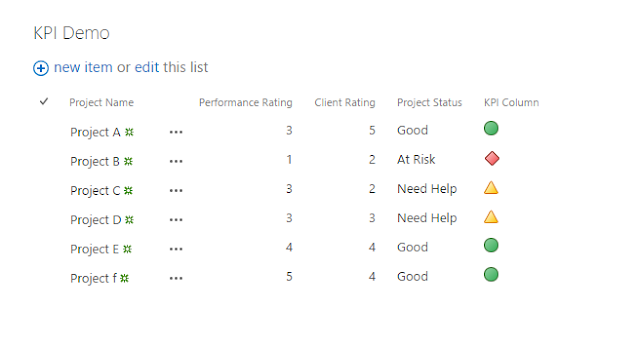
In a recent Meetup, I came across a question "What is the simplest way of creating a KPI in SharePoint with out of the box capabilities". So in this post, I will walk you through a simple KPI with SharePoint calculated columns, and jQuery. For this I have created a SharePoint list named KPI Demo, below is how it looks.

Step - 1: Let's create a column named "Project State" which is a calculated field.
- For this, click on "edit", located on the top of the list(you can see in the figure above).
- Click on the little plus sign beside the column name "Client Rating" as shown below, and select "More Column Types":
- In the following screen name the column as "Project Status" and the field type as a "Calculated Column". Now paste the following formula in the calculated column formula field


Here is how the calculation is done:
- If a project's performance rating + client rating is greater than 7, set the value to "Good"
- If a project's performance rating + client rating is less than or equals 7 and greater than and equals 5, set the value to "Needs Help".
- If a project's performance rating + client rating is less than 5, set the value to "At Risk".
Step - 2: Append our KPI Indicators to the Project Status column.
For this we will be using jQuery. Please refer to this post, for creating a scripts and styles library. If you think it is too much for you to take from the post in the link above, follow these simple steps:- Create a document library and name it as "Scripts"
- Right click on this point, click on "Save link As", and save it with name "jQuery.js".
- Now upload the "jQuery.js" file you have saved in the previous step to your document library named "Scripts".
- Now the Scripts library should look like the image below
- Now click on the "Open Menu" icon and copy the link to jQuery as shown below.

Now save this link to a sticky note or notepad.
Step - 3: The big part
Now let's open a note editor, I personally prefer notepad++ and copy the code below to the text editor, and save as "Kpi.js"- In the above script, we have looked for the column index of the column "Project Status" from our SharePoint list.
- Then we loop through the table that has the column named "Project Status".
- Once we find the table in the page, we iterate through each row of the table and find the column values at the column index.
- In the switch case we check if the value is either "Good" or "Need Help" or "At Risk" and based on this we append the kpi image. Don't worry of changing the KPI image url, most of the SharePoint environments have an image at that address.
Once the JavaScript file is saved, our scripts-document library should look something like the below image.

Step - 4: Creating the Page
- Now, before we go further, lets copy the path of our "KPI.js" file from our Scripts folder, similar to our Step - 2.
- Now create a new webpart page in SharePoint. To do that, click on the site settings icon at the top and click on "Site Contents".

- Then click on "Site Pages", to open the library. From the top breadcrumb, click the arrow below new, and click on "webpart page" and name the page and select a layout. For this demo, I have selected the default layout.

- Once the page is created, it will be opened in edit mode as shown below.

- Now click on the top most "Add a Web Part" section. From the top menu click on category "Media and Content". From the right pane select "Content Editor" and click "Add".

- Now, click on the little arrow on the right of the content editor and click "edit webpart".

- An options pane opens on the right hand side. Paste the link to our "KPI.js" file in the first textbox and click save.
- Now in the middle webpart section, click on "Add a Web Part" button. From the Categories pane, select "Apps". And from the right pane select our list "KPI Demo", and click "Add".
- Now click on "Stop Editing" on the top left corner.
- If everything goes well, our list now looks as in the image below.


Step - Optional: Change the look
In case if you wish to have the KPI's in a separate column. Create a single line field named "KPI column", and replace the script with the below.
After replacing the script with the above, the list would look something like the below image.
After replacing the script with the above, the list would look something like the below image.
Post a Comment